Detecting Anomalous Transformer Behaviour
A transformer can operate in the power network for 60 years or more, and over that time develop a signature pattern of behaviour. Standard diagnostic tools will flag these quirks as requiring repair, but as long as the behaviour of the transformer isn’t changing, this aged behaviour is not serious enough to fix. Anomaly detection is more useful than diagnostics for older transformers, so that any deviations away from its usual pattern of quirky behaviour are caught and flagged for repair.
The Data Science
Anomaly detection techniques have a key disadvantage: they can generate lots of false positives where behaviour has changed, but not due to a developing fault. Changes in the transformer’s environment, such as hot days, high winds, and high current flow, can all affect the transformer’s behaviour in ways that may look like a fault.
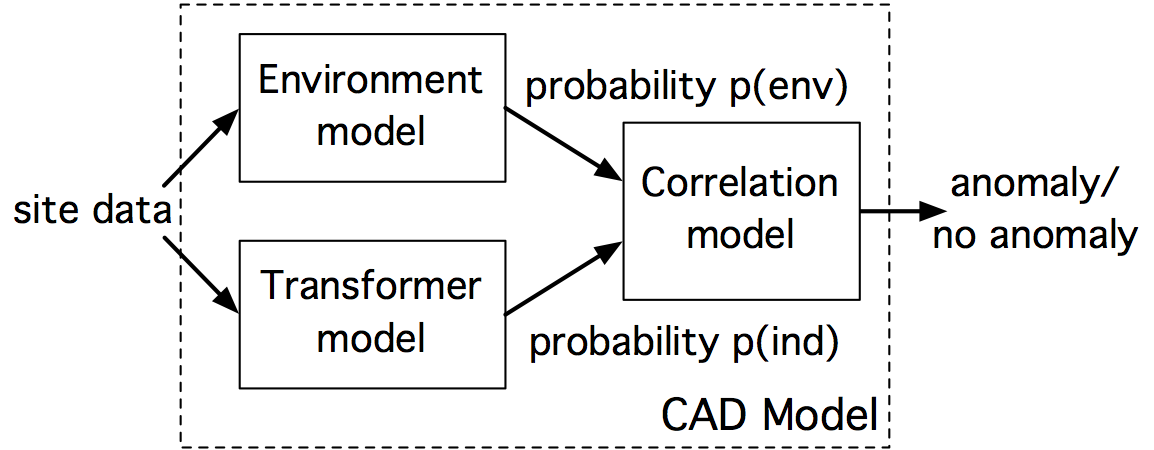
I selected Conditional Anomaly Detection (CAD) as an appropriate technique for this application. CAD learns two probabilistic models – one of the environmental parameters, and one of the condition indicator parameters – then learns the correlations between the two. Anomalies are only flagged when abnormal condition indicators occur in a normal environment.
Results
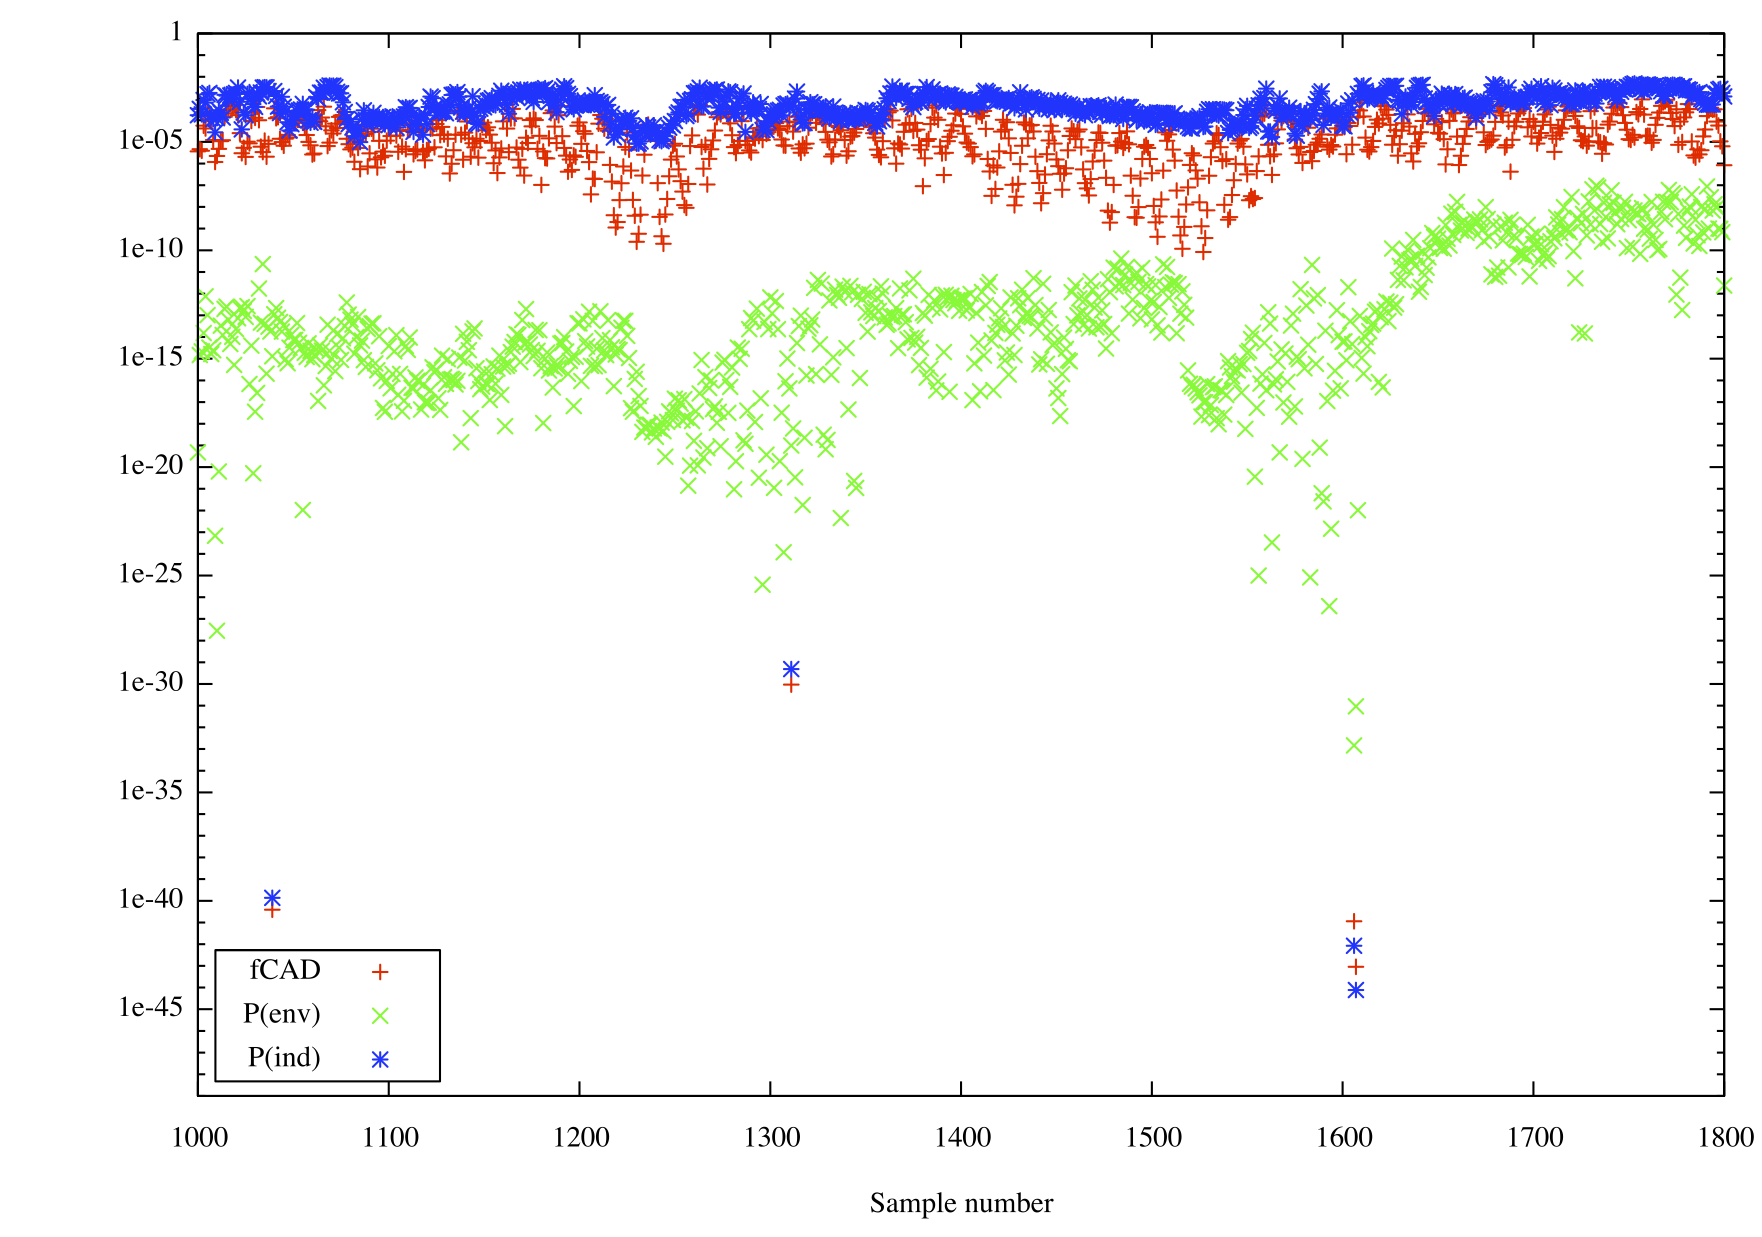
I applied CAD to two transformers on the network in England, which were reaching the end of their design life. Online monitoring showed no anomalous behaviour within the transformers, and they remained operational for an extra 18 months. Two months of data were used to train the CAD model, which detected 21 anomalies over the next 16 months. These anomalies were all due to sensor and logging issues, where plausible but incorrect values were recorded for transformer condition parameters.
Resources
Papers detailing this work: